Sustainability at Haycarb
Sustainability continues to shape how Haycarb creates value today while building a more resilient and responsible business for the future. ACTIVATE 2030, our sustainability roadmap, translates this into measurable action across five key ESG pillars: RESTORE, INSPIRE, EXCITE, UPLIFT and INNOVATE.





As an early adopter of SLFRS S1 and S2, Haycarb continues to strengthen how we assess and communicate material sustainability and climate-related risks and opportunities (SRROs and CRROs) across our value chain. Our independently assured disclosures provide deeper analysis of the anticipated financial effects of our principal climate-related risks and opportunities.
Progress towards 2030
ACTIVATE 2030 translates our sustainability ambitions into measurable action across five pillars. Explore this year’s progress, impact metrics, target status and featured stories.
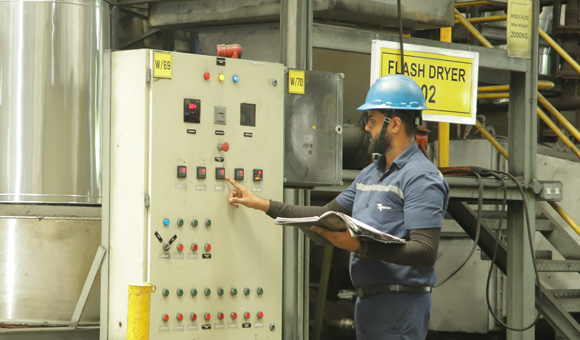
Protecting and restoring the natural systems connected to our operations and value chain
RESTORE focuses on the natural resources and environmental systems that shape how we operate: the energy we use, the water we manage, the materials we transform and the ecosystems connected to our sites. In FY2025/26, our focus was on practical action: expanding renewable energy, improving waste heat recovery, strengthening water reuse, supporting circularity and embedding climate-conscious practices across our operations.
Impact in action
Selected reported outcomes from the year
Progress towards 2030
FY2025/26 performance against ACTIVATE 2030 commitments.
| Commitment | FY2025/26 | 2030 target | Status |
|---|---|---|---|
| Renewable-energy use | 9% increasevs FY2022/23 baseline | 50% increase | 18% · Progressing |
| Energy intensity | 18.44GJ/Rs. Mn | 17.83 GJ/Rs. Mn | 69% · On track |
| Scope 1 and 2 emissions | 29,369tCO₂e | 19,464 tCO₂e | Requires acceleration |
| Solid-waste intensity | 0.08MT/Rs. Mn | 0.094 MT/Rs. Mn | 100% · Target achieved / exceeded |
| Sustainable raw-material packaging | 700k–800k bags/sackswith greater bulk-bag use | 25% reduction | Progressing |
| Sustainable water sourcing | 16%of total water | 10% | 100% · Target achieved / exceeded |
| Water reuse and recycling | 4%of total water | 15% | 27% · Progressing |
| Water intensity | 11.79m³/Rs. Mn | 7.46 m³/Rs. Mn | Requires acceleration |
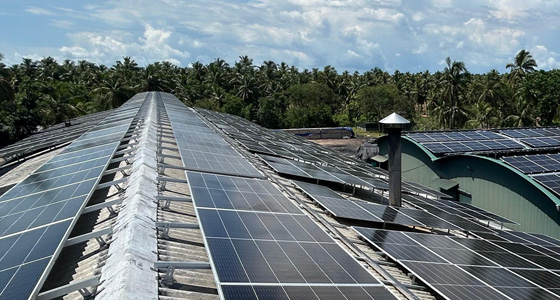
Restoring value through waste heat utilisation
A closer look at how Haycarb is improving dryer efficiency by replacing LPG use with recovered waste heat, reducing fuel dependency and supporting lower-emission operations.
Explore storyS1 & S2 Climate Risk & Opportunity Outlook
How does climate change affect our value chain?
Explore four principal climate-related risks and opportunities, from the factors shaping each issue to the potential operational and financial effects across the short, medium and long term.
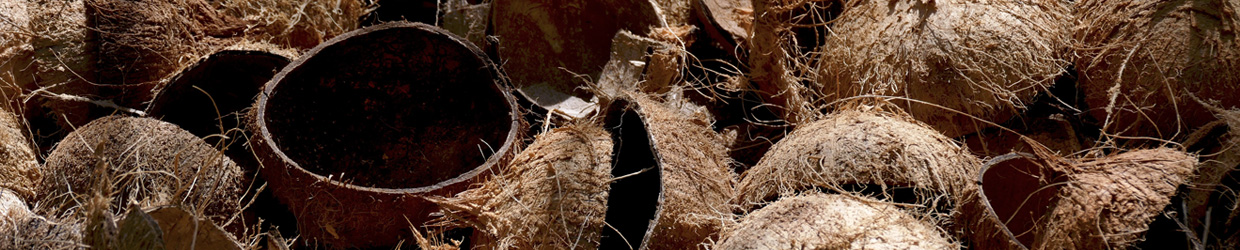
Climate risk to raw material supply
Climate pressure can tighten coconut shell charcoal supply and raise input costs.
Key climate & operational factors
What does this mean for Haycarb?
Driver and anticipated financial effect
Quantified operational drivers and financial effects across the short, medium and long term
How this risk behaves across climate futures
Lower physical stress supports a more stable sourcing outlook, though ageing plantations and under replanting remain constraints.
DivergenceHigher physical stress amplifies yield variability and feedstock constraints, increasing charcoal availability and cost pressure.
Annual Report Climate Resilience Assessment